On the UnchartedX site and Youtube channel, a predynastic Egyptian vase from 5000+ years ago was scanned and the data published. You can find the file at the following link.
UnchartedX Predynastic Vase STL file
Here, we take a look at the data only. We’ll do some precision calculations on the outside of the vase as well as the top and inside of the opening.
Before we begin, let’s define some terms.
Accuracy is how close a measured value is to the actual value.
Precision is how close measured values are to each other.
We can’t measure accuracy since we don’t know what the original design was. An example of accuracy is creating a 1kg weight. How close it is to actually weighing 1kg is a measure of its accuracy. 1kg is a predetermined target.
Measuring precision is taking a lot of samples and seeing how close they are to each other. For example, with a firing mechanism shooting a projectile to a target, we can look at multiple shots and see how close all the shots are to each other on the target. It doesn’t need to be close to the center (that would be accuracy).
For this vase, we are going to measure precision. We can see that it has a circular shape. This is true at any vertical position. So one measure of accuracy would be to take points along a narrow vertical height, say less than 1cm (the vase is about 12cm high) and compare the distance to the center axis for all the points. This would give an idea of the precision of the vase for representing a circle. This has already been done for several parts of the vase and we will not revisit that here.
Main Body
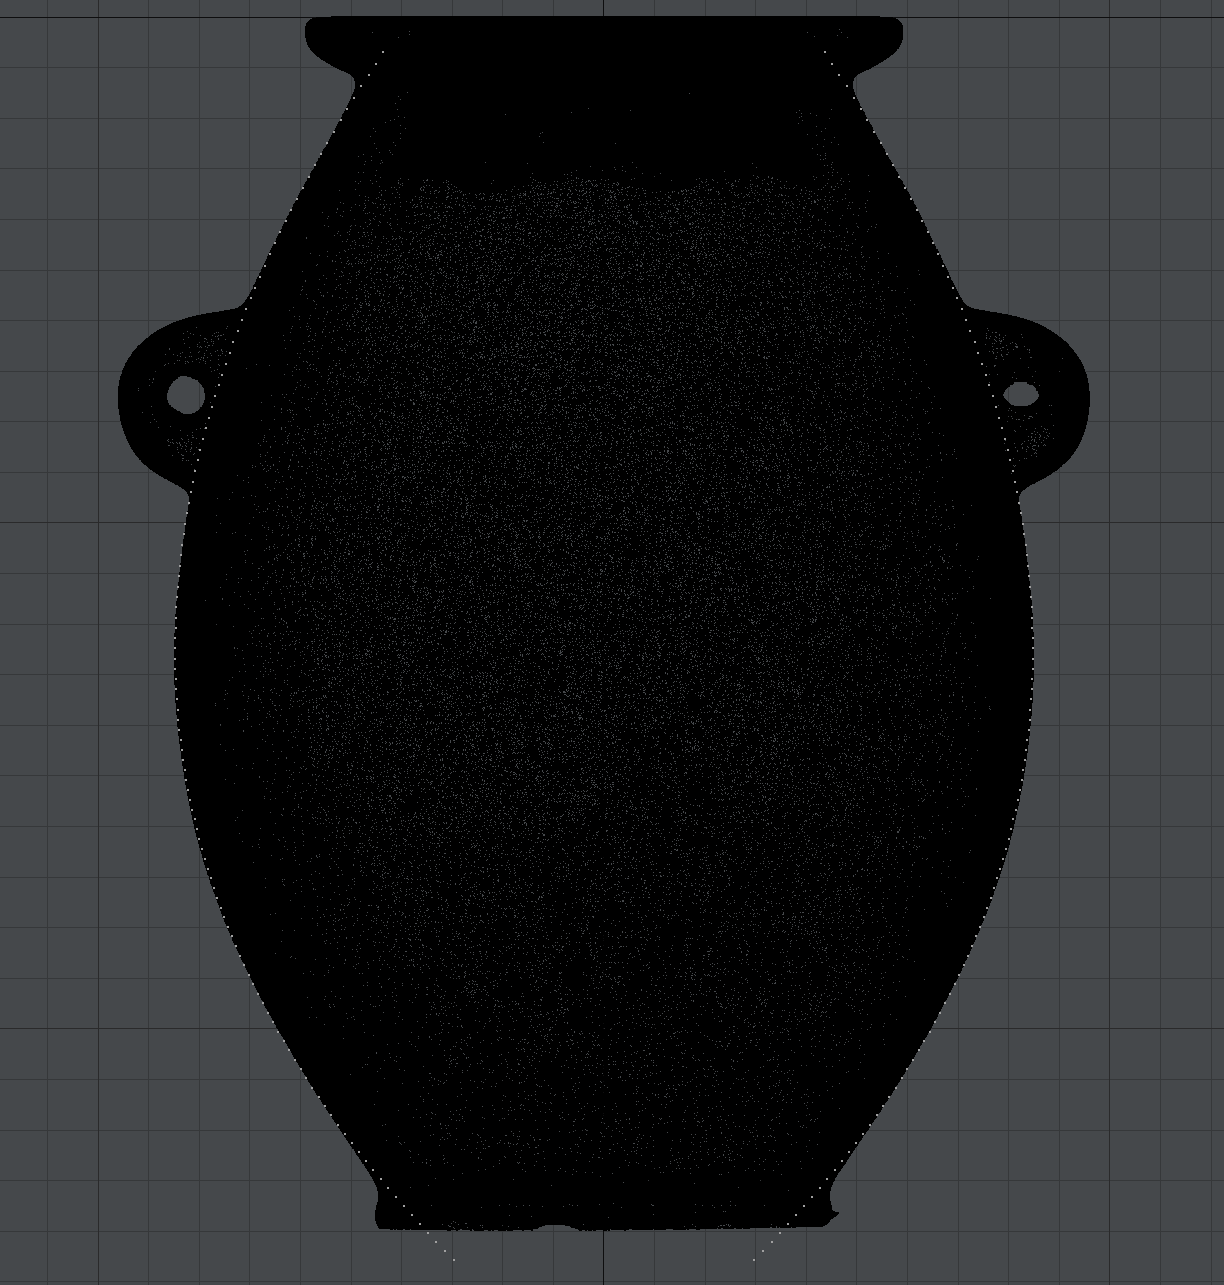
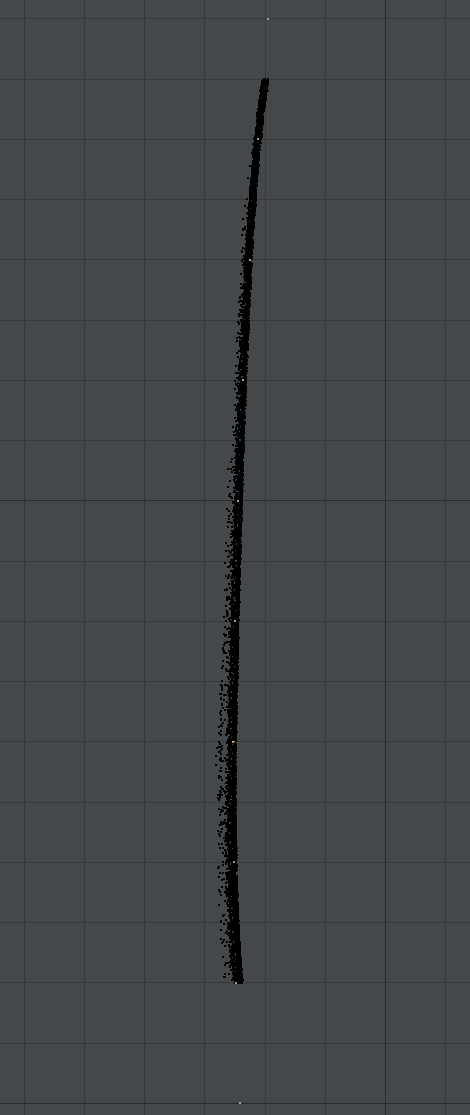
What we notice with the outside profile of the vase is that it has a very regular curved shape. And that is where we’ll start. Instead of looking at one part of the vase at a time, let’s see if we can fit a curve to the outside of the vase. To do this, we need to convert the 3D points into a 2D graph so that we may do some least squares regression and see if a particular curve fits the profile of the vase.
To convert from 3D to 2D, it’s very easy. We already mentioned that the vase is circular. So we can compute the distance to the center axis. That will be our new X value. The Y value will be the distance from the top of the vase (positive down). We can now represent the new vase with 2d points. We can already see that the distance to the center for ALL points is VERY regular.
(Click on images for larger version)
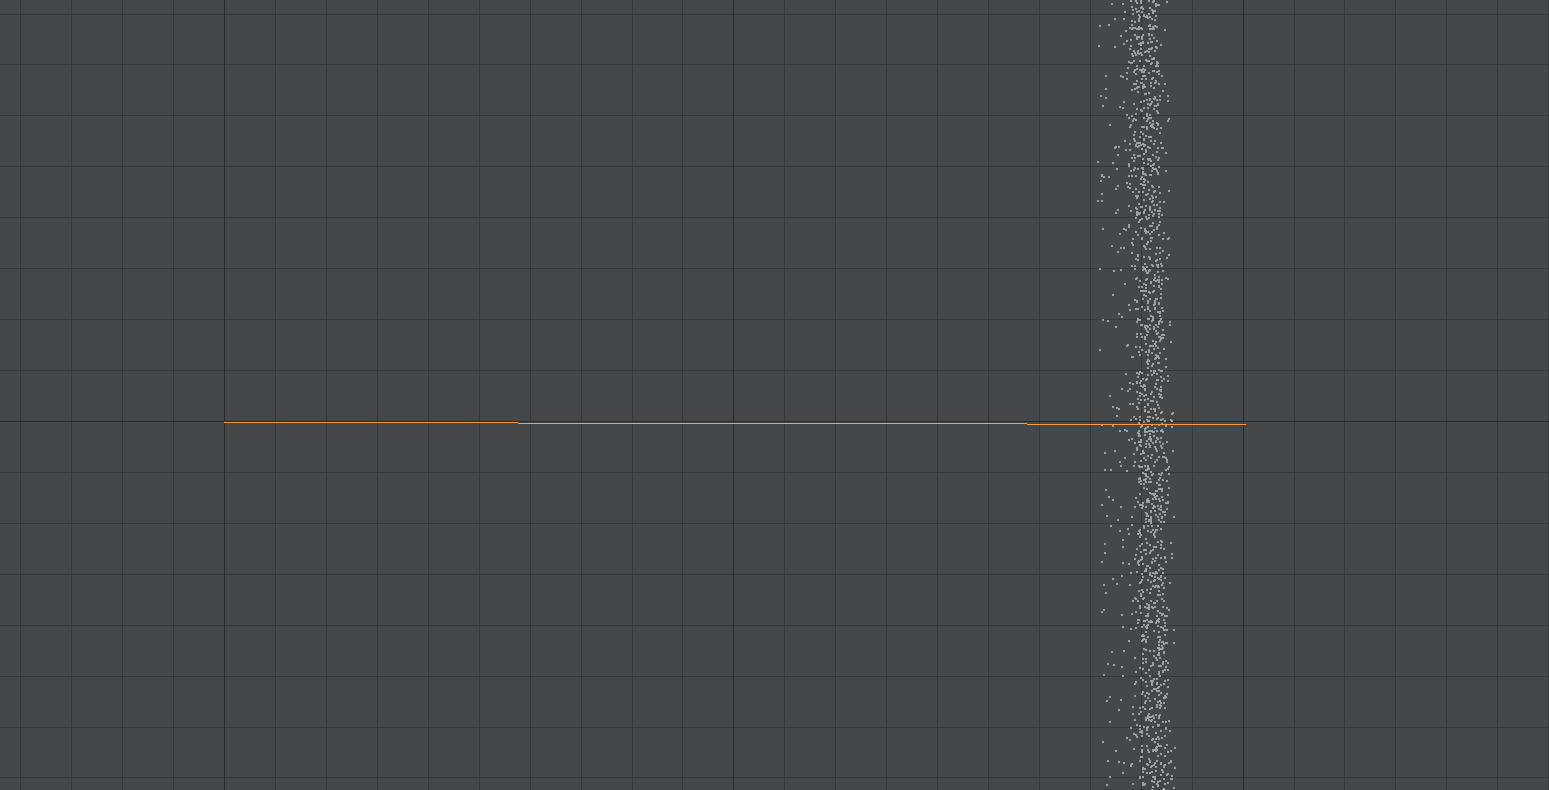
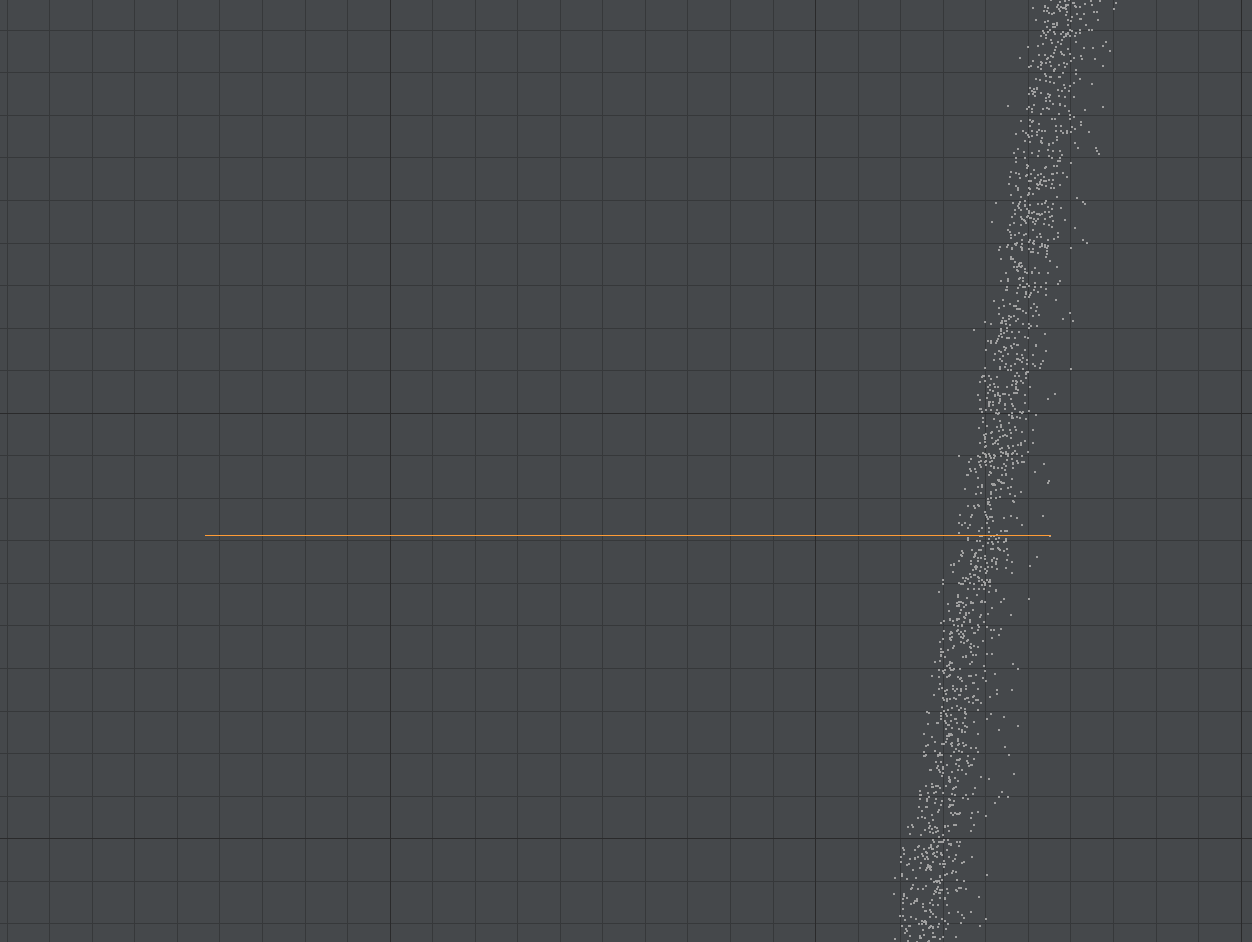
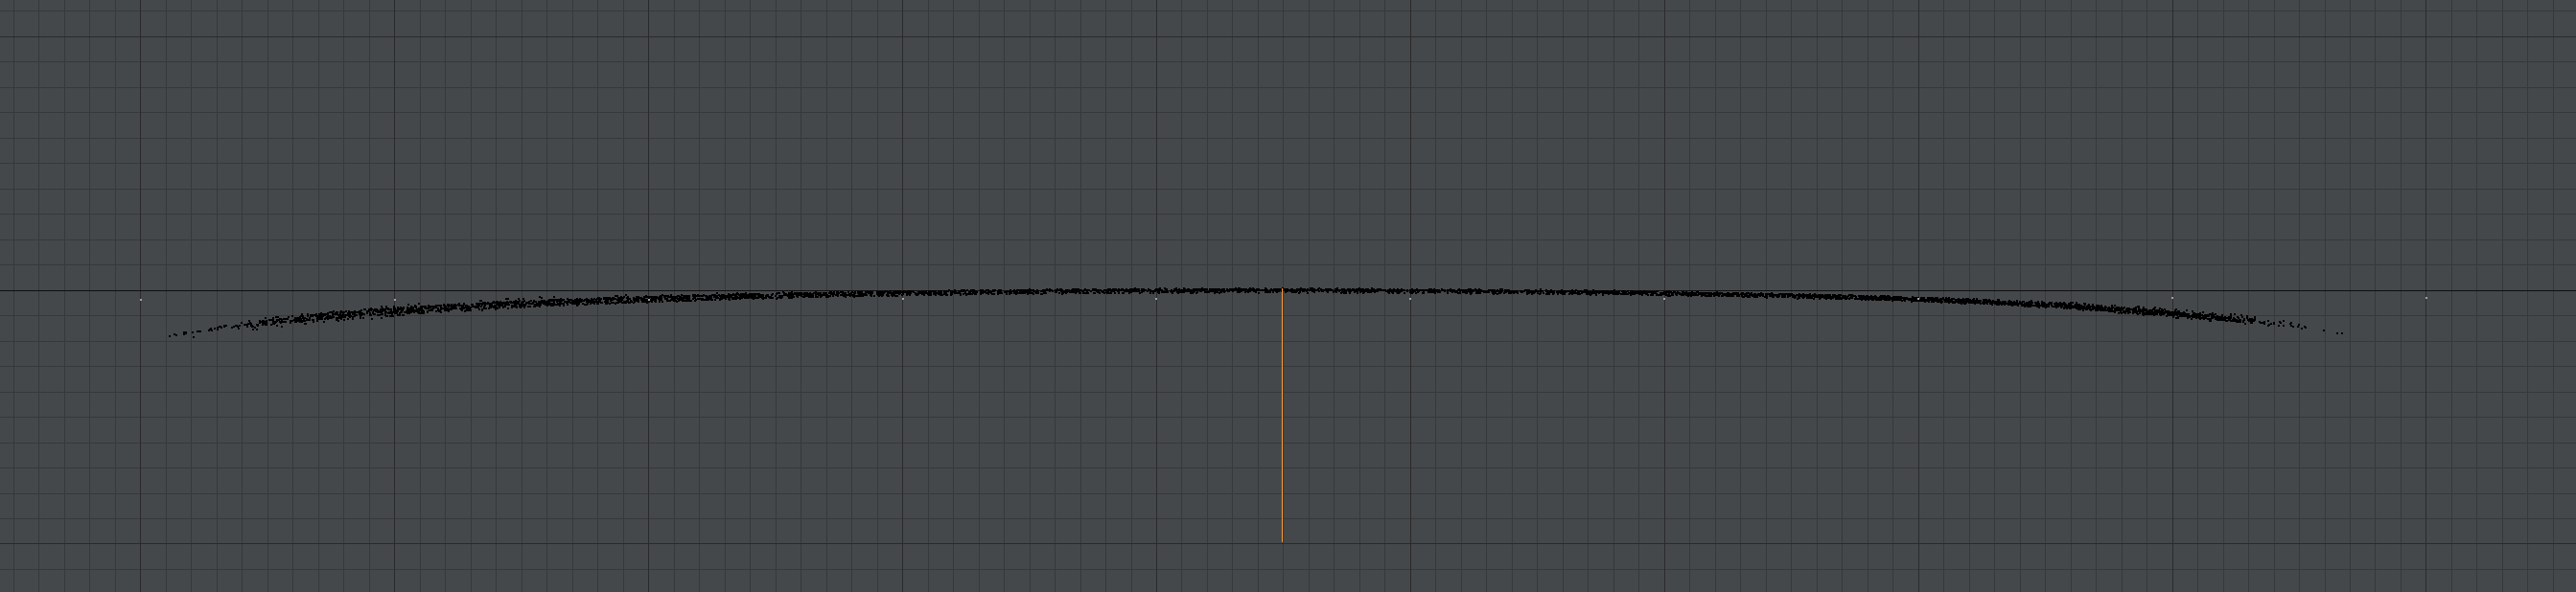
Above is a zoomed in region of our 2D plot. The X axis is the distance from the center. Another way to look at this is as if ALL the points on the outside of the vase are facing toward the right. This means ALL the points are overlapping. The orange line is 1mm in length. So looking at the grid in gray, we see that two boxes of the heavy dark gray lines is 1mm. And thus, two of the small boxes is 1/10th of a mm. Or 0.1mm. And we see that all the points fit within two small boxes vertically. Right off, we know that the precision of the vase is within 0.1mm. And this is something many people don’t fully grasp. It’s not just that any given area is smooth. It is smooth with areas on the other side of the vase. The vase is circular down to 0.1mm at least. Note that the accuracy of the scanner is 1/1000th of an inch or about 25 micron (0.025mm). So we’re already getting close to the limits of the scanner.
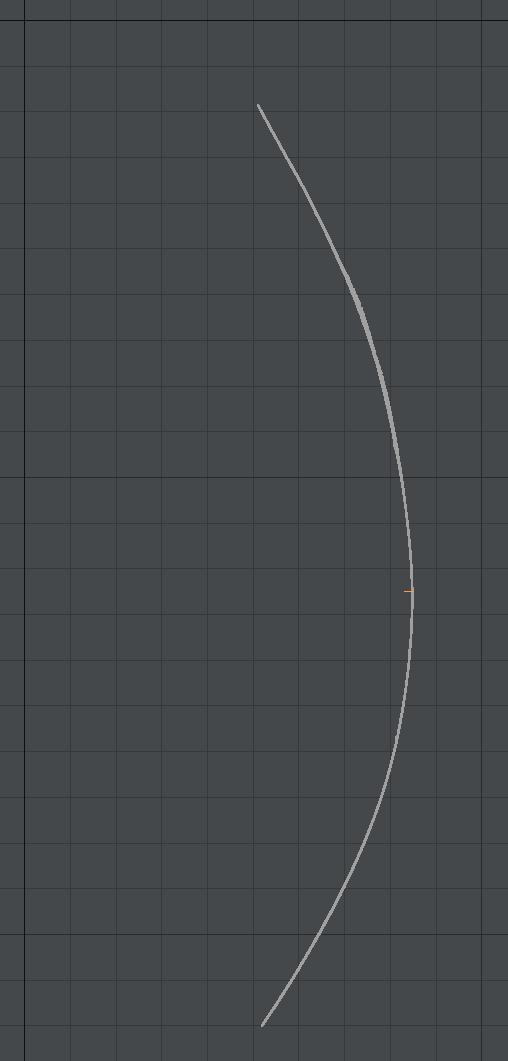
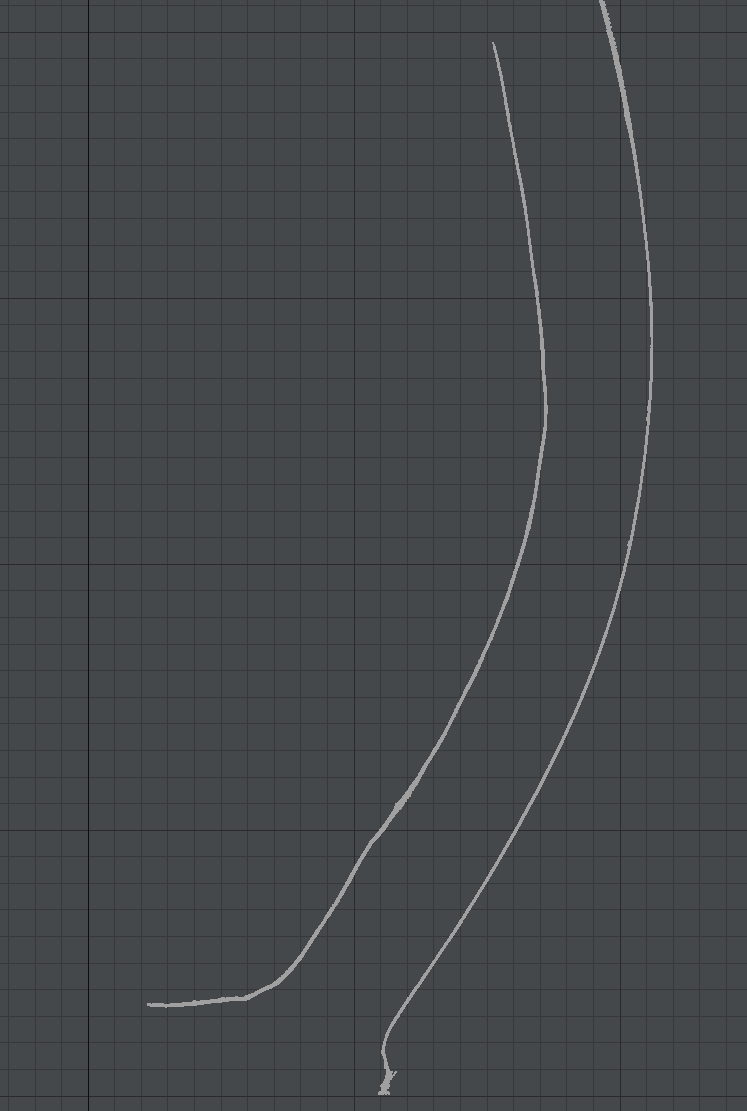
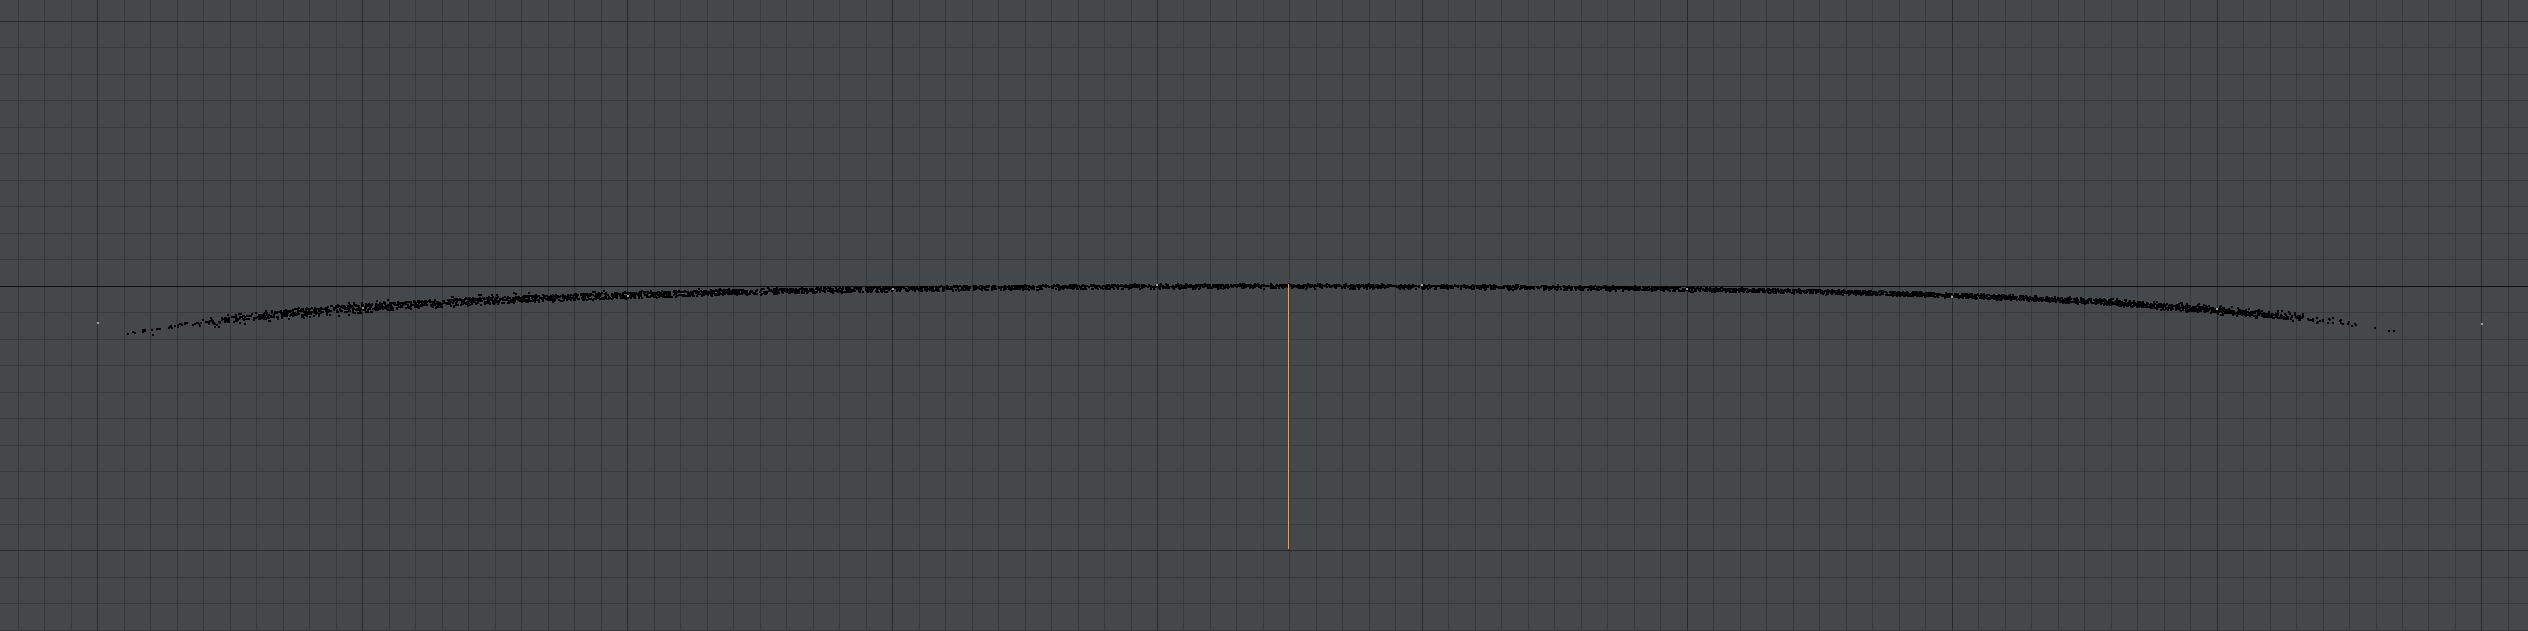
Here is an image of the entire profile. Note that the orange line is the exact same line as above in the exact same position. It is still 1mm in length.
Visually, we can see this is very precise. But we want actual numbers. The first thought was that this might be a parabola. I did least squares regression and got the following equation of a parabola (x and y are swapped from the usual way of representing it because our parabola is sideways).
x = 17.6884 mm + 0.811426y – 0.00665197y^2
We can see this curve in the following image. The white dots are points along the parabola. The black dots are the original vase profile (distance from center axis).
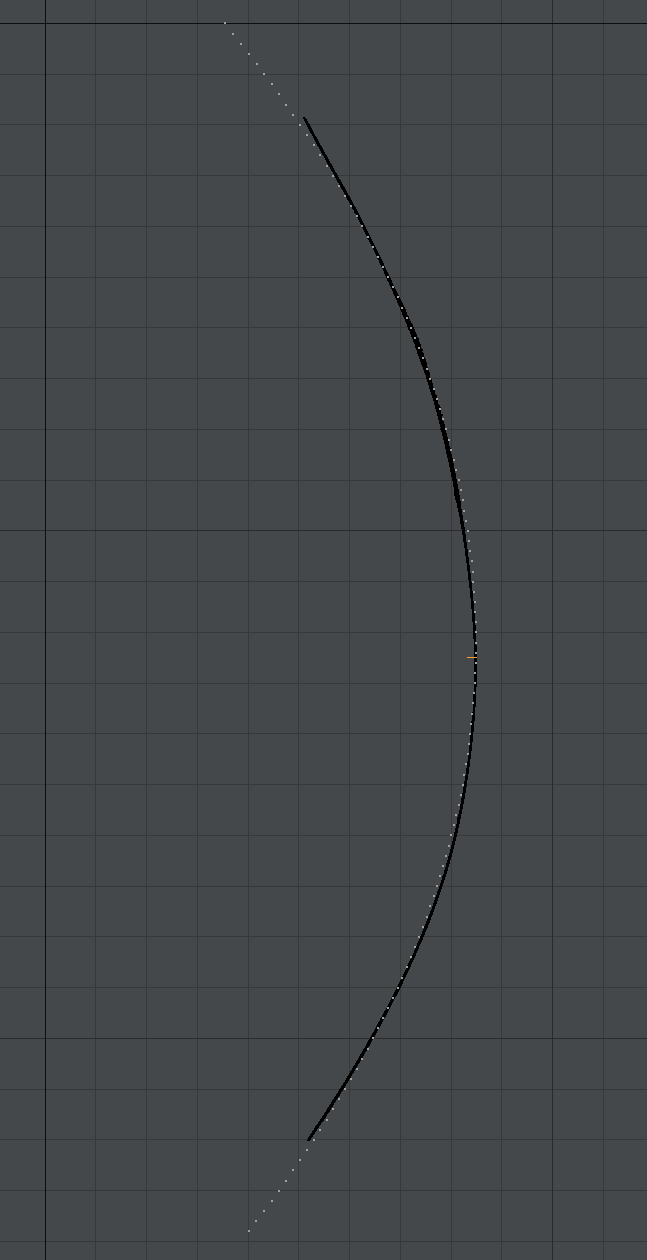
That’s not a bad fit. The error rate is good too.
Average deviation: 0.24994276 mm
Standard Deviation: 0.14771621
Those are very good numbers. But a visual inspection shows that something isn’t quite right. If we zoom in toward the bottom half of the vase, we see that it diverges. It’s still only 0.5mm off, but it’s noticeable.
At this point, we should talk about how precision is calculated. If this were a perfectly flat vertical surface like a cylinder, we’d just take the distance from the center (our X coordinate) and subtract it from the average. We would then take the absolute value (make it positive). And then add them all up and divide by the number of points to get the average deviation.
The problem here is that it’s not a straight line. So we do least squares regression to get a best fit curve to the data. At 0.25mm average deviation from the parabola generated, it’s not terrible. But we can do better. Much better.
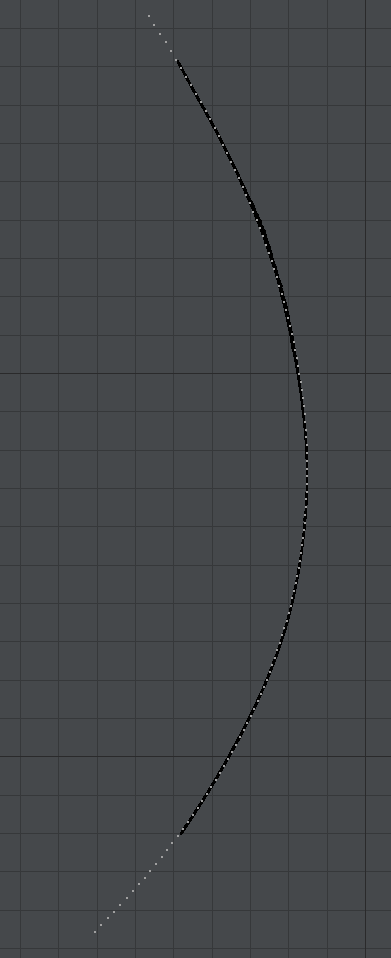
A property of a parabola is that it is symmetrical. So I took the original vase data, made a copy and flipped it vertically. Then I rotated it until I saw that it matched the existing profile. Here is what I got.
The white points are flipped and rotated 18 degrees. The midpoint would be 9 degrees and that’s where the vertex of the parabola would be.
This time, we do least squares regression again, but we rotate all the 2D points by 9 degrees. The resulting (unrotated) parabola is as follows.
x = 22.0122 mm + 0.917091y – 0.0068798y^2
Average deviation: 0.08342912 mm
Standard deviation: 0.05335629
Now that’s impressive. 83 micron average deviation is less than 0.1 mm.
Here is what that curve looks like now.
Let’s zoom in on the bottom half of the vase again.
That’s a much better fit.
Let’s see the parabola on each side of the original data.
Now that’s a perfect fit. This is clearly the shape that was intended. We do notice that at the very bottom of the vase, the vase diverges a bit from the parabola. It tapers out to fit the shape of the bottom of the vase. The same is true at the top near the lip of the vase. You can see the handles also taper out and use a rounded shape before connecting to the main body of the vase. Every part of the vase is rounded like this.
Inside
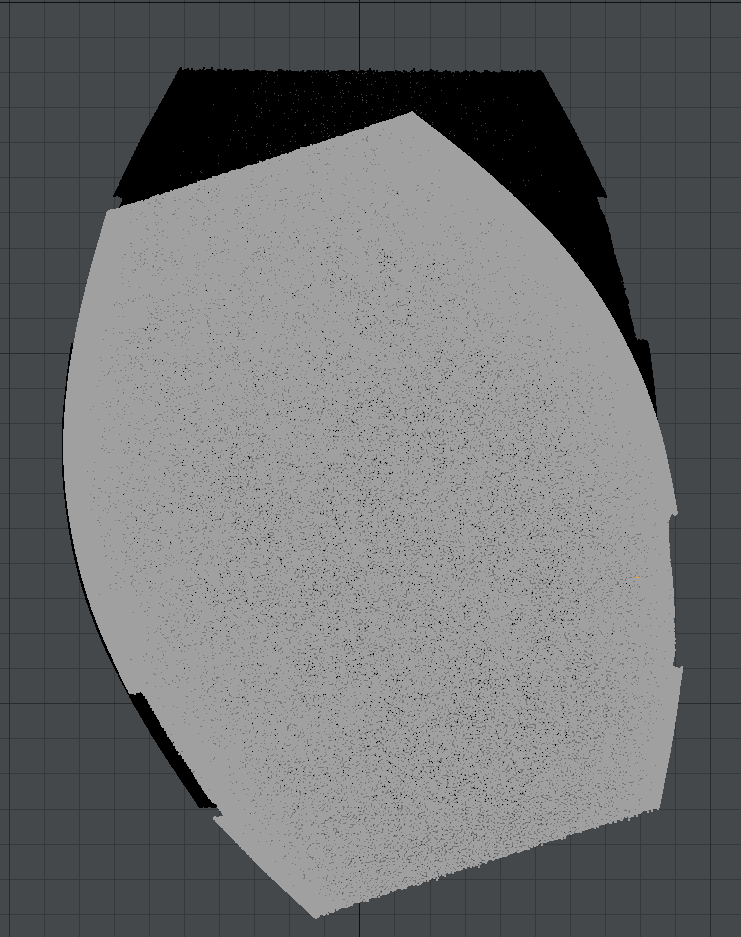
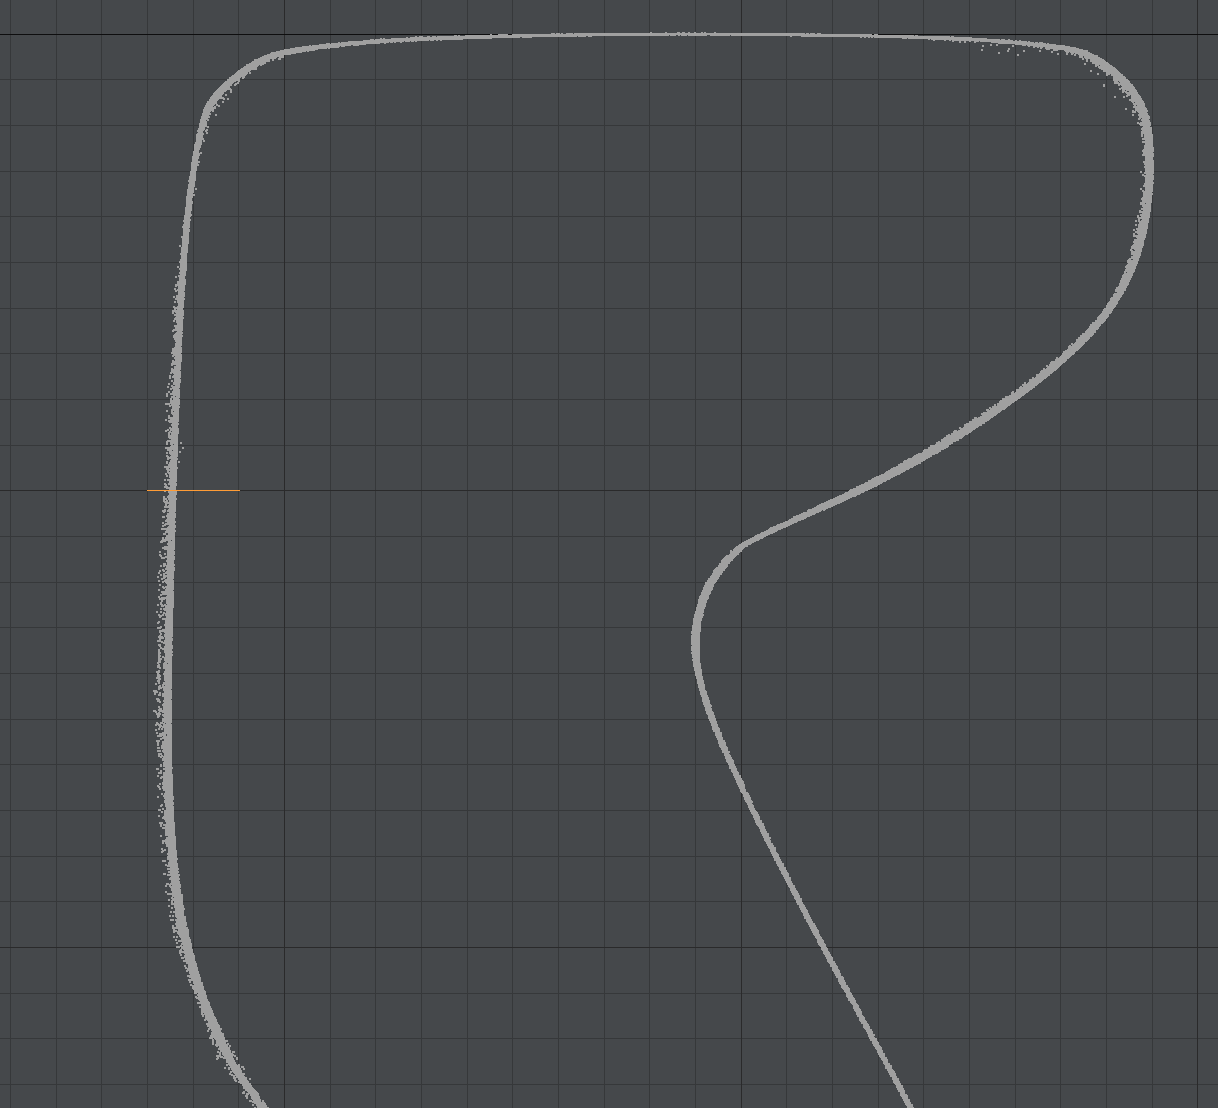
Before analyzing the top of the vase, let’s look at the inside. This was only partially scanned and is agreed to be the less finished part of the vase. There are obvious rings. The profile does not follow a smooth curve. But looking at the profile (2D points showing the distance to the center axis OR rotating all the points to point right as done above) something interesting shows up.
The inside is extremely symmetrical 360 degrees around just like the outside. The only difference is that the profile doesn’t follow as smooth a curve. Yet it is still very precise and still perfectly aligned to the rest of the vase. If we zoom in (see image below), we see that most of the inside of the vase is precise to about 125 microns (0.125mm). Not as precise as the outside, but an impressive amount of precision for a part of the vase that appears unfinished. If it is indeed unfinished, it means the inside was left as it. And since the rings are still visible, it wasn’t smoothed out. That would indicate a tool that naturally gives this amount of precision on its own.
(Zoomed in section of inside of vase with all points overlapping. Orange line is 1 mm)
Top Cylinder
The mouth opening cylinder just inside the vase is perpendicular to the top surface of the vase. However, as mentioned above, every part of this vase is curved even if only visible at the micron level and the mouth cylinder is no exception. It has a slight inclination toward the center of the vase before curving outwards. This makes sense for a vase if a cover made of a different material were used. A perfect cylinder would allow it to not fall into the vase. Here is the profile of the top of the vase. Again, ALL points are rotated to the right and are overlapping. Orange line is 1mm.
The top cylinder has some damage and I’ve tried to remove as much of it as possible to not interfere with the original profile. But we can see the inner cylinder has some less precise areas as compare to the top or main body of the vase. Note that the top of the outside of the vase is extremely precise. Much more than what was shown earlier. So don’t be fooled into thinking this is a rough area. The numbers will surprise you. What’s happening is that the rest of the top of the vase is WAY more precise than anything we’ve seen yet. We’ll get into that later. For now, we can fit a portion of the inner cylinder to a vertical line as well as a parabola to calculate the upper bound of the precision. We will look at 1.5mm to 9mm from the top. Not quite a centimeter in height, but it does cover most of the inside cylinder area.
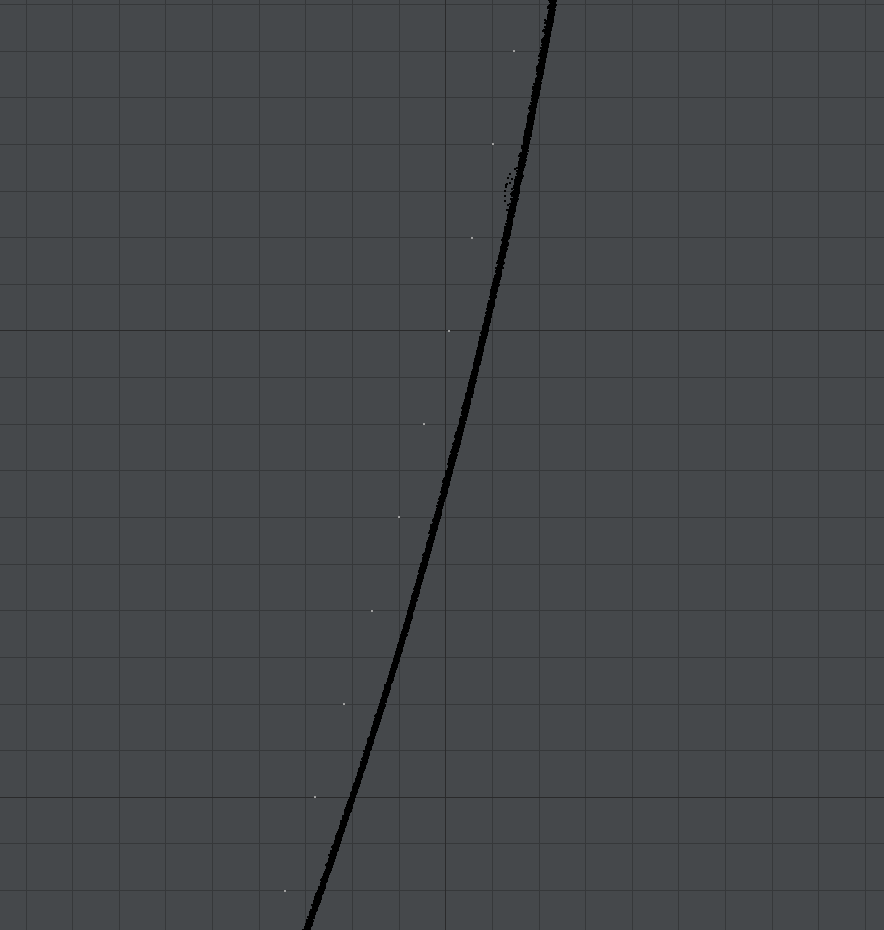
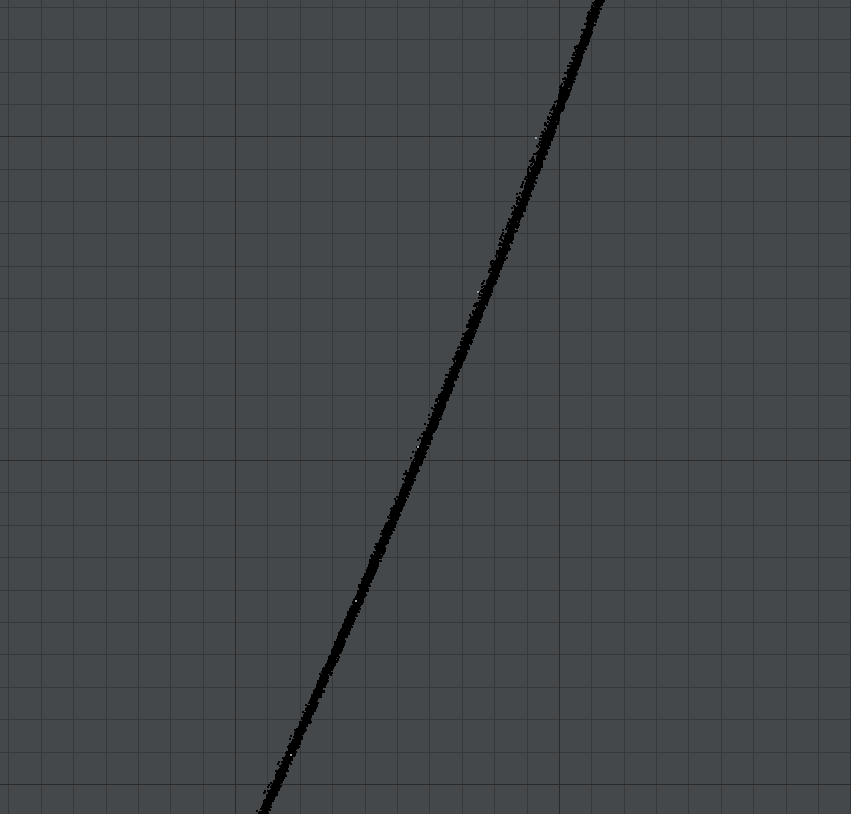
Here it is fitted to a line. White dots are along the line (slight inclination, see below). And the orange line is 1mm in length as per usual.
(White points along line. Black points are ALL points of the mouth inner cylinder.)
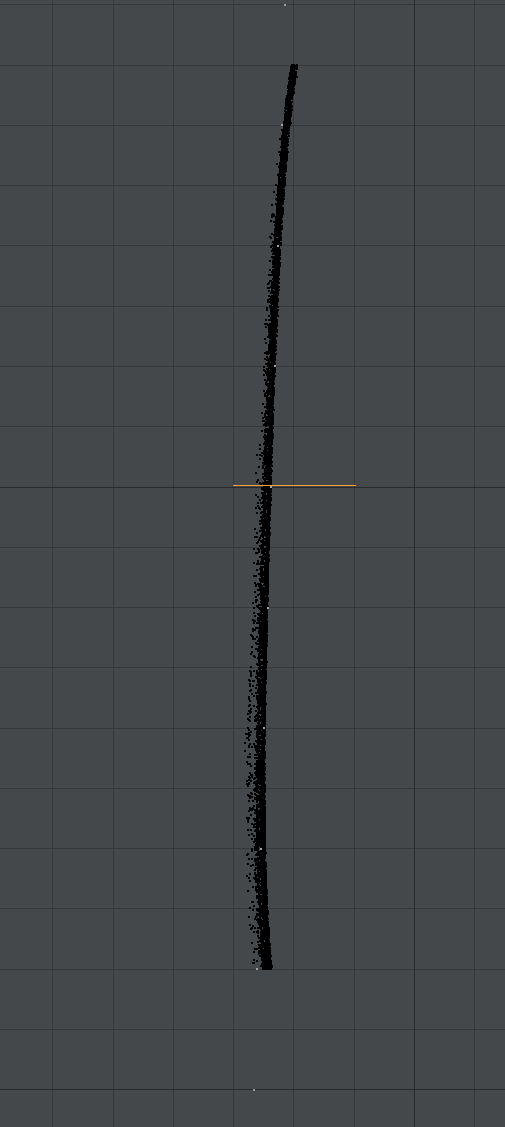
The equation for the line is:
x = 18.9554 mm -0.0288997y
Based on this equation, we see that for every cm in height, the line moves inwards by just under 0.3mm.
Indeed we see that there is a slight curve that spans about 0.3mm in width. So this line is not the best fit, but it will let us set an upper limit on the precision that we can reduce later.
Average Deviation: 0.03111431 mm
Standard Deviation: 0.02646061
This shows an average deviation of 31 micron. The outside of the vase as a whole had a precision of 84 micron. This is nearly 3 times smoother than the outside of the vase and yet is the roughest part of the top of the vase. 31 micron is very near the limit of the scanner’s accuracy. So much of this deviation will be due to scanner precision, not the roughness of the vase. And this is our current upper limit. Can we do better. It has a slight curve. So let’s look at fitting a parabola.
(White points along parabola. Black points are ALL points of the mouth inner cylinder.)
x = 19.1289 mm -0.108452y + 0.0074662y^2
Average Deviation: 0.01936051 mm
Standard Deviation: 0.01634504
As a sidenote, higher order equations don’t lower the deviation. So it does appear parabolas (conics in general) are in use here.
This is 19 microns of precision. This is just beyond the accuracy of the scanner. So even though the cylinder appears a bit rough when zoomed in, it is actually smoother than the scanner can detect at 25 microns or 1/1000th of an inch.
Our new upper limit for precision is 25 microns, the scanner’s limit.
What needs to be said now is that we have scanned the roughest part of the top of the vase and it’s smoother than the what the scanner can detect. The rest of the top of the vase is smoother. A device that has an accuracy of 25 microns doesn’t mean it can’t scan areas with more precision than that. Some samples can indeed be more “accurate”, but we don’t know which ones. So areas that have a precision of 25 microns could be more precise in reality. Said another way, the device could be accurate to 1 micron for 95% of samples. But that’s not good enough. The stated accuracy will usually be for 99% or higher percentage of the samples. The opposite is rarely true. Errors don’t cancel out to be perfectly flat. This happens a lot with LIDAR. For example, flat roofs are often detected as perfectly flat beyond the accepted accuracy of the device because flat areas tend to register nearly identically. For this reason, flat roofs are often used to align multiple LIDAR scans to each other and even detect and pitch, yaw or roll between scans (as well as scale).
With that said, let’s look at the top surface.
Top Surface
For this sections, there was a lot of damage. I removed what I could. I wanted to look at the inner parts of the top section and leave out the areas where it curves downwards.
We will start with least squares regression to a line.
(White points are along the computed line. Orange line is 1mm in length as per usual)
Really need to view the image above at full resolution to appreciate what is going on here. This area is extremely flat.
The equation for the computed line is:
y = 0.0525567 mm -0.000759746x
For every meter (1000 mm), it deviates vertically by 0.7 mm. That is well beyond the device’s accuracy. This top surface is perfectly flat and horizontal as far as the device can detect.
Average Deviation: 0.02621979 mm
Standard Deviation: 0.01879303
We see that the precision is exactly the limit of the device.
Just for fun, let’s look at the least squared regression for a parabola. It would be a very shallow parabola (micron level). But I’m curious to see what we would get.
(White points are along the computed parabola. Orange line is 1mm in length as per usual)
We see the edges taper out. So I wouldn’t rule out an oval. As we’ve mentioned before, all the shapes blend into each other. But this is good enough for our purposes since we’re already at the device’s accuracy limit.
y = 4.29983 mm -0.351822x + 0.00718871x^2
Average Deviation: 0.00603443 mm
Standard Deviation: 0.00510236
The points above have a precision of 6 microns. If you look at the standard deviation, we know that 99.7% of the samples will be within three standard deviations.
So 6+3*5=21 microns. That’s very close to the stated accuracy of the device. Even though the mean appears to give a higher precision than the device’s accuracy, we see that the full range of samples is almost exactly the stated accuracy.
Regardless, this area is VERY flat and smooth. I hope we’ll see higher accuracy scans in the future. That statement alone should indicate that something very different was happening with this vase to require single micron or sub-micron scans.
Conclusion
The level of precision in this vase is astounding. You don’t accidentally arrive at this kind of precision. I’ve heard an often repeated argument that there were a range of different quality vases. Some are worse. Some are better. With enough time, effort and people, you’ll eventually get a vase that is excellent quality. IOW, the vases quality is a spectrum and these are just on the higher end. The problem is that this is like saying building one wheelbarrow a day for a million years, at some point, some of the wheelbarrows will be of such precision as to be equivalent to a Ferrari. That will never happen. The vase discussed here and others like it are in a completely different category. You don’t accidentally stumble onto sub 25 micron precision. The outside profile of the vase fits a 9 degree rotated parabola perfectly. This cannot be done by hand. We haven’t even mentioned that this vase is made of granite, a very hard substance. The area between the handles cannot be made with a lathe. A lathe would need to resist sub micron movement and vibrations. Therefore this idea that the higher precision vases are on a range similar to other less precise vases is completely untenable.
Regarding the lathe, many people don’t understand that any kind of force on an object will cause the lathe to tilt at least at the micron level and we wouldn’t get the level of precision seen here. At least not with the tools of the time. A common example of this principle is to attach a 1 meter string to two poles. How much force do you need to apply before the string is perfectly horizontal? The answer is that it’s impossible. The string will break before that happens. Gravity will exert a downward force on the string and as long as ANY downward force exists, the string will never be horizontal no matter how much you pull on the ends. The same happens to a lathe. The resistance to force of the lathe would need to be so high as to not move even at sub micron distances. Said differently, the lathe would have to be an order of magnitude more precise and resistant than the vase. Equal force on both sides would require multiple tools perfectly aligned. Could these problems be surmounted? Maybe. By people who didn’t have the wheel? I have land on the moon to sell.
A great point was made by others that bears repeating. If the technology existed to make the part of the vase between the handles, then you could use the same technology for the entire vase and that technology did not involve a lathe because the handles are in the way.
Another point is that any time you move either the tool or the object, you lose alignment. We see no such loss in alignment on this vase. This vase was either done all in one go. Or they had calibration tools at the micron level that could realign their tools.
This vase was not done by hand or by hand held tools. Period.